What does brushing and linking mean in information visualization?
Visualization systems generally consist of several independent visualizations, each allowing exploration of a different aspect of data. Over years, researchers have developed several interaction techniques to allow users to explore data. Two of these several techniques are Brushing and Linking.
Brushing refers to several interaction techniques that allow the user to select a subset of data in a visualization. Consider the following node-link visualization:
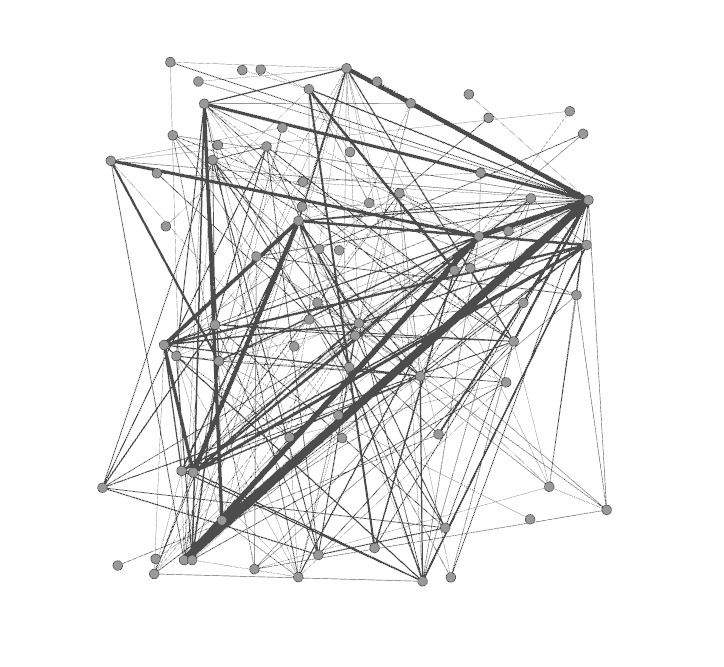
A node-link graph with several nodes and images.
It contains several nodes and edges making it difficult to make sense of the graph. Suppose the user only wants to focus his exploration on a certain node and all its connected nodes. To do this she would select a subset of nodes. This selection as shown in the following figure is called brushing.
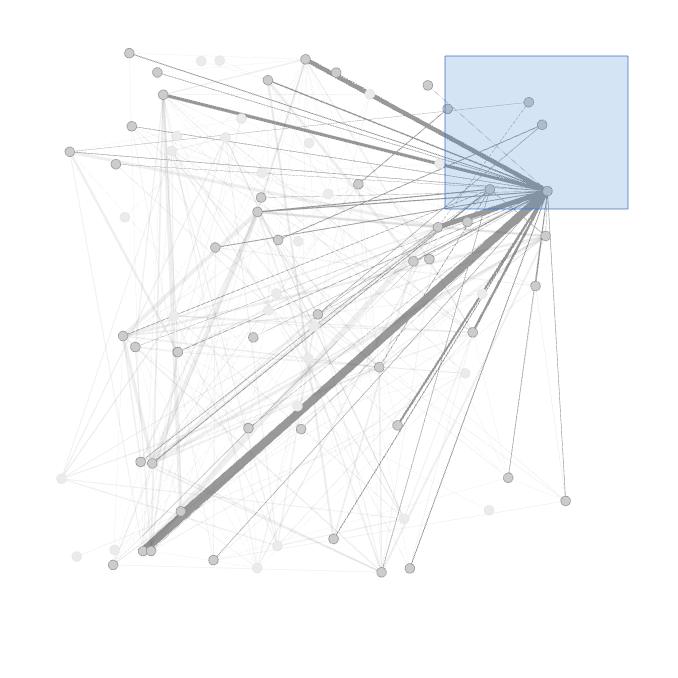
A subset of nodes selected in the graph.
As I mentioned that most visualization software consist of several different types of visualization. It is often required to visualize a subset of data in different visualizations. This requirement is facilitated by the interaction technique called Linking. When a set of data elements is selected in a visualization, the same set gets selected in the other visualizations as well. For instance, consider the document view in CZSaw for VAST 2010 mini-challenge1 data-set.
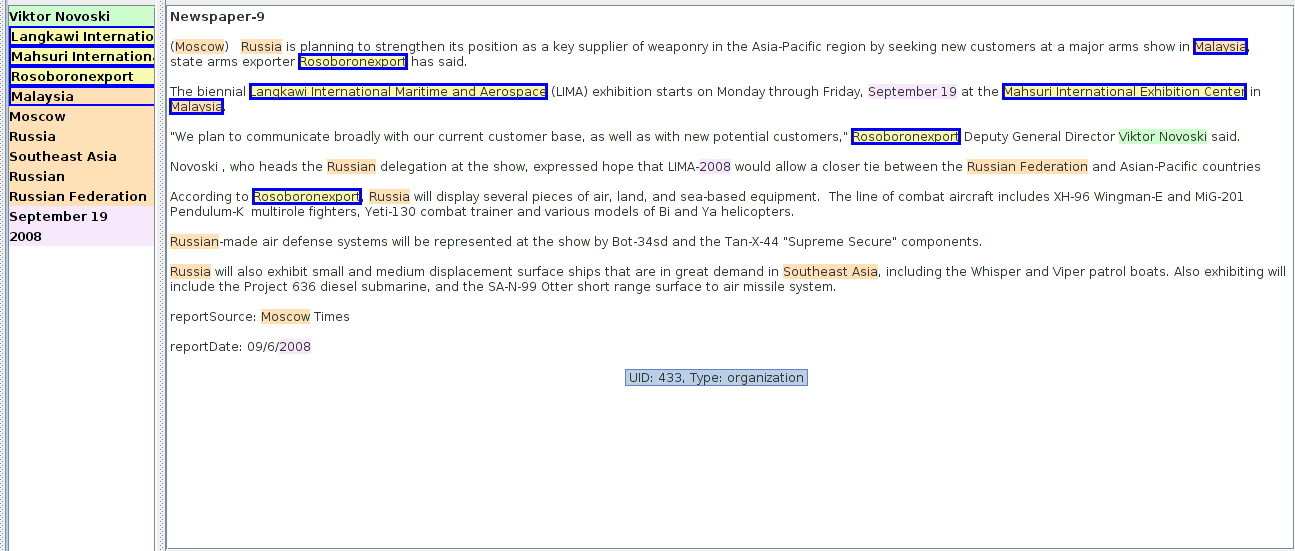
Document view in CZSaw that brushes the entities selected in a list to a document.
In the document view of CZSaw, when a set of data elements (called entities) is selected in a list of entities, they get selected in the in corresponding document as well as any other visualization such as the hybrid view below:
Brushing and Linking are two important interaction techniques that are supported in almost every visualization software. Brushing used with Linking form form a very powerful interaction and exploration of data in different visualization software.